Lines in HTML5 canvas
last modified July 17, 2023
A line is a simple graphics primitive. A line is an object which connects two points.
In HTML5 canvas, a line is created with a path object. A path is a list of points,
connected by segments of lines that can be of different shapes, curved or not, of different
width and of different colour. Within a path object, a line is created with the lineTo
method.
Lines
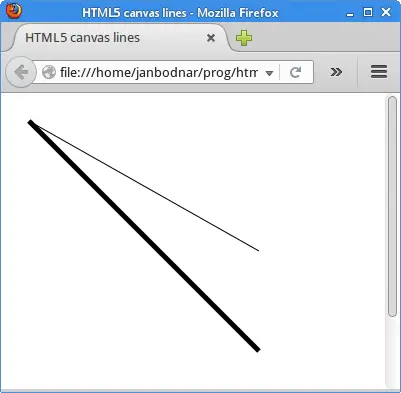
The following example draws two lines.
<!DOCTYPE html>
<html>
<head>
<title>HTML5 canvas lines</title>
<script>
    function draw() {
        var canvas = document.getElementById('myCanvas');
        var ctx = canvas.getContext('2d');

        ctx.beginPath();
        ctx.moveTo(20, 20);
        ctx.lineTo(250, 150);
        ctx.stroke();

        ctx.beginPath();
        ctx.moveTo(20, 20);
        ctx.lineTo(250, 250);
        ctx.lineWidth = 5;
        ctx.stroke();
    }
</script>
</head>

<body onload="draw();">
    <canvas id="myCanvas" width="350" height="350">
    </canvas>
</body>
</html>
Two lines are drawn. The second line is thicker.
ctx.beginPath();
The beginPath method creates a new path. Once created, subsequent
drawing commands are directed into the path and used to build the path.
ctx.moveTo(20, 20);
The moveTo method moves the pen to the coordinates
specified by x and y.
ctx.lineTo(250, 150);
The lineTo method draws a line from the current drawing
position to the position specified by x and y.
ctx.stroke();
The stroke method draws the line by stroking its outline.
ctx.lineWidth = 5;
The lineWidth sets the width of the second line; the line is
thicker.
Crisp lines
Lines with odd widths appear to be blurred. This is because the lines are rendered in between the grid lines of a canvas. There is a quick solution for this—shifting the coordinates by a half unit.
<!DOCTYPE html>
<html>
<head>
<title>HTML5 canvas crisp lines</title>
<script>
    function draw() {
        var canvas = document.getElementById('myCanvas');
        var ctx = canvas.getContext('2d');

        ctx.lineWidth = 1
        ctx.beginPath();
        ctx.moveTo(20, 20);
        ctx.lineTo(250, 20);
        ctx.stroke();

        ctx.beginPath();
        ctx.moveTo(20, 40);
        ctx.lineTo(250, 40);
        ctx.stroke();

        ctx.translate(0.5, 0.5);

        ctx.beginPath();
        ctx.moveTo(20, 60);
        ctx.lineTo(250, 60);
        ctx.stroke();

        ctx.beginPath();
        ctx.moveTo(20, 80);
        ctx.lineTo(250, 80);
        ctx.stroke();
    }
</script>
</head>

<body onload="draw();">
    <canvas id="myCanvas" width="350" height="350">
    </canvas>
</body>
</html>
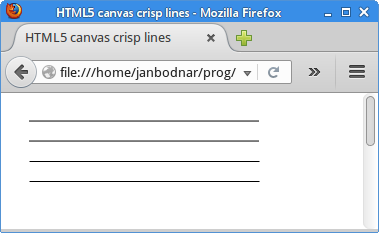
The example draws four lines. The first two are slightly blurred, the other two are more smooth.
ctx.lineWidth = 1
We have a line with an odd width.
ctx.translate(0.5, 0.5);
This is a quick fix for the blurriness of the lines. The translate
method moves the coordinate system by a half unit.
Line dashes
Lines can be drawn using various dashes. A dash is a pattern which is created by mixing
opaque and transparent sections. A dash is specified with the setLineDash
method of the canvas context.
<!DOCTYPE html>
<html>
<head>
<title>HTML5 canvas line dashes</title>
<script>
    function draw() {
        var canvas = document.getElementById('myCanvas');
        var ctx = canvas.getContext('2d');

        ctx.translate(0.5, 0.5);

        ctx.beginPath();
        ctx.setLineDash([2]);
        ctx.moveTo(10, 10);
        ctx.lineTo(250, 10);
        ctx.stroke();

        ctx.beginPath();
        ctx.setLineDash([7, 2]);
        ctx.moveTo(10, 20);
        ctx.lineTo(250, 20);
        ctx.stroke();

        ctx.beginPath();
        ctx.setLineDash([4, 4, 1]);
        ctx.moveTo(10, 30);
        ctx.lineTo(250, 30);
        ctx.stroke();
    }
</script>
</head>

<body onload="draw();">
    <canvas id="myCanvas" width="350" height="250">
    </canvas>
</body>
</html>
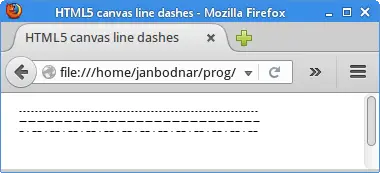
The example draws three lines with different dash patterns.
ctx.setLineDash([2]);
This line will alternate opaque and transparent sections of 2 coordinate units.
ctx.setLineDash([4, 4, 1]);
Here, the dash consists of the following pattern: 4 units drawn, 4 units not drawn, 1 unit drawn.
Caps
Caps are decorations applied to the ends of unclosed subpaths and dash segments.
There are three different end caps in Java 2D: 'square',
'round', and 'butt'.
'butt'— ends unclosed subpaths and dash segments with no added decoration.'round'— ends unclosed subpaths and dash segments with a round decoration that has a radius equal to half of the width of the pen.'square'— ends unclosed subpaths and dash segments with a square projection that extends beyond the end of the segment to a distance equal to half of the line width.
<!DOCTYPE html>
<html>
<head>
<title>HTML5 canvas line caps</title>
<script>
    function draw() {
        var canvas = document.getElementById('myCanvas');
        var ctx = canvas.getContext('2d');

        ctx.translate(0.5, 0.5);
        ctx.lineWidth = 8;

        ctx.beginPath();
        ctx.lineCap = 'square';
        ctx.moveTo(10, 10);
        ctx.lineTo(250, 10);
        ctx.stroke();

        ctx.beginPath();
        ctx.lineCap = 'round';
        ctx.moveTo(10, 30);
        ctx.lineTo(250, 30);
        ctx.stroke();

        ctx.beginPath();
        ctx.lineCap = 'butt';
        ctx.moveTo(10, 50);
        ctx.lineTo(250, 50);
        ctx.stroke();

        ctx.lineWidth = 1;
        ctx.beginPath();
        ctx.moveTo(10, 0);
        ctx.lineTo(10, 60);
        ctx.stroke();

        ctx.beginPath();
        ctx.moveTo(250, 0);
        ctx.lineTo(250, 60);
        ctx.stroke();

        ctx.beginPath();
        ctx.moveTo(254, 0);
        ctx.lineTo(254, 60);
        ctx.stroke();
    }
</script>
</head>

<body onload="draw();">
    <canvas id="myCanvas" width="350" height="250">
    </canvas>
</body>
</html>
In our example, we show all three types of end caps.
ctx.lineWidth = 8;
We increase the width of the lines in order to see the caps better.
ctx.lineCap = 'square';
The line cap is specified with the lineCap context attribute.
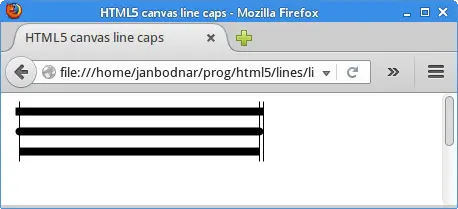
The vertical lines emphasize the difference in size of the lines.
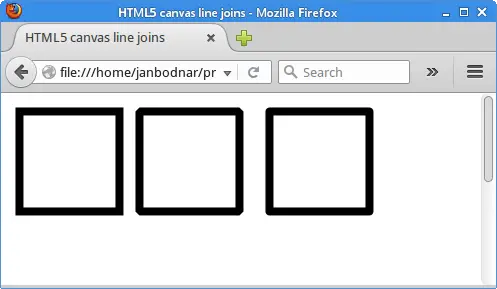
Joins
Line joins are decorations applied at the intersection of two path segments and
at the intersection of the endpoints of a subpath. There are three decorations:
'bevel', 'miter', and 'round'.
'bevel'— joins path segments by connecting the outer corners of their wide outlines with a straight segment.'miter'— joins path segments by extending their outside edges until they meet.'round'— joins path segments by rounding off the corner at a radius of half the line width.
<!DOCTYPE html>
<html>
<head>
<title>HTML5 canvas line joins</title>
<script>
    function draw() {
        var canvas = document.getElementById('myCanvas');
        var ctx = canvas.getContext('2d');

        ctx.translate(0.5, 0.5);
        ctx.lineWidth = 8;

        ctx.lineJoin = 'miter';
        ctx.strokeRect(10, 10, 100, 100);

        ctx.lineJoin = 'bevel';
        ctx.strokeRect(130, 10, 100, 100);

        ctx.lineJoin = 'round';
        ctx.strokeRect(260, 10, 100, 100);
    }
</script>
</head>

<body onload="draw();">
    <canvas id="myCanvas" width="450" height="350">
    </canvas>
</body>
</html>
This code example show three different line joins in action.
ctx.lineWidth = 8;
With thin lines, it is difficult to tell the differences between
the types of joins. For this reason, we make the lines thicker by
setting the lineWidth to eight units.
ctx.lineJoin = 'miter';
The line join is set with the lineJoin attribute.
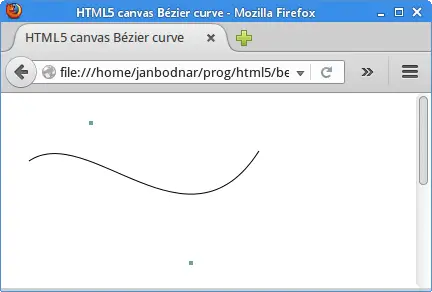
Bézier curves
Bézier curves are curved lines (splines) defined by mathematical formulas. The mathematical method for drawing curves was created by Pierre Bézier in the late 1960's for the manufacturing of automobiles at Renault.
The bezierCurveTo method of the canvas context adds a cubic
Bézier curve to the path. It requires three points: the first two points are
control points and the third one is the end point. The starting point is the
last point in the current path, which can be changed using moveTo
before creating the Bézier curve. The shape is modified by moving the control
points.
<!DOCTYPE html>
<html>
<head>
<title>HTML5 canvas Bézier curve</title>
<meta charset="utf-8">
<script>
    function draw() {

        var canvas = document.getElementById('myCanvas');
        var ctx = canvas.getContext('2d');

        ctx.beginPath();
        ctx.moveTo(20, 60);
        ctx.bezierCurveTo(80, 20, 180, 160, 250, 50);
        ctx.stroke();

        ctx.fillStyle = 'cadetblue';
        ctx.fillRect(80, 20, 4, 4);
        ctx.fillRect(180, 160, 4, 4);
    }
</script>
</head>

<body onload="draw();">
    <canvas id="myCanvas" width="350" height="350">
    </canvas>
</body>
</html>
The example draws one Bézier curve.
ctx.moveTo(20, 60);
With the moveTo method, we define the start point
of the curve.
ctx.bezierCurveTo(80, 20, 180, 160, 250, 50);
With the bezierCurveTo method, we add a Bézier curve
to the path. The first two points are the control points; the last
point is the ending point of the curve.
ctx.fillStyle = 'cadetblue';
ctx.fillRect(80, 20, 4, 4);
ctx.fillRect(180, 160, 4, 4);
These lines paint the control points of the curve.
In this part of the HTML5 canvas tutorial, we worked with lines.