JavaFX Charts
last modified October 18, 2023
In this part of the JavaFX tutorial, we work with charts. In JavaFX, it is possible to build charts by adding just a few lines of code.
In the following examples, we create a line chart, an area chart, a scatter chart, a bar chart, and a pie chart.
JavaFX LineChart
A line chart is a basic type of chart which displays information as a series of data points
connected by straight line segments. A line chart in JavaFX is created with the
javafx.scene.chart.LineChart.
package com.zetcode;

import javafx.application.Application;
import javafx.scene.Scene;
import javafx.scene.chart.LineChart;
import javafx.scene.chart.NumberAxis;
import javafx.scene.chart.XYChart;
import javafx.scene.layout.HBox;
import javafx.stage.Stage;


public class LineChartEx extends Application {

    @Override
    public void start(Stage stage) {

        initUI(stage);
    }

    private void initUI(Stage stage) {

        var root = new HBox();

        var scene = new Scene(root, 450, 330);

        var xAxis = new NumberAxis();
        xAxis.setLabel("Age");

        var yAxis = new NumberAxis();
        yAxis.setLabel("Salary (€)");

        var lineChart = new LineChart<>(xAxis, yAxis);
        lineChart.setTitle("Average salary per age");

        var data = new XYChart.Series<Number, Number>();
        data.setName("2016");

        data.getData().add(new XYChart.Data<>(18, 567));
        data.getData().add(new XYChart.Data<>(20, 612));
        data.getData().add(new XYChart.Data<>(25, 800));
        data.getData().add(new XYChart.Data<>(30, 980));
        data.getData().add(new XYChart.Data<>(40, 1410));
        data.getData().add(new XYChart.Data<>(50, 2350));

        lineChart.getData().add(data);

        root.getChildren().add(lineChart);

        stage.setTitle("LineChart");
        stage.setScene(scene);
        stage.show();
    }

    public static void main(String[] args) {
        launch(args);
    }
}
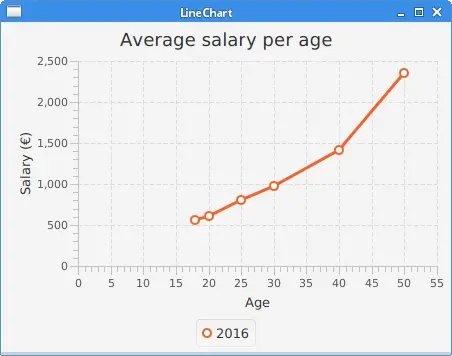
In the example, we have a line chart showing average salary per age.
var xAxis = new NumberAxis();
xAxis.setLabel("Age");

var yAxis = new NumberAxis();
yAxis.setLabel("Salary (€)");
Two axes are created with the NumberAxis. The setLabel
method sets a description for the axis.
var lineChart = new LineChart<>(xAxis, yAxis);
lineChart.setTitle("Average salary per age");
LineChart creates a line chart. The setTitle method
sets a title for the chart.
var data = new XYChart.Series<Number, Number>();
data.setName("2016");
A XYChart.Series provides data series for the chart. A data series
is a list of data points. Each data point contains an x value and a y value. The
setName method gives a series a name. (There may be multiple of
series in one chart.)
data.getData().add(new XYChart.Data<>(18, 567));
data.getData().add(new XYChart.Data<>(20, 612));
...
We add data to the data series. XYChart.Data is a single data item
with data for 2 axis charts.
lineChart.getData().add(data);
The data is inserted into the chart.
JavaFX AreaChart
An area chart displays graphically quantitative data that change over time.
package com.zetcode;

import javafx.application.Application;
import javafx.scene.Scene;
import javafx.scene.chart.AreaChart;
import javafx.scene.chart.CategoryAxis;
import javafx.scene.chart.NumberAxis;
import javafx.scene.chart.XYChart;
import javafx.scene.layout.HBox;
import javafx.stage.Stage;


public class AreaChartEx extends Application {

    @Override
    public void start(Stage stage) {

        initUI(stage);
    }

    private void initUI(Stage stage) {

        var root = new HBox();
        var scene = new Scene(root, 490, 350);

        var xAxis = new CategoryAxis();
        xAxis.setLabel("Time");

        var yAxis = new NumberAxis();
        yAxis.setLabel("Thousand bbl/d");

        var areaChart = new AreaChart<>(xAxis, yAxis);
        areaChart.setTitle("Oil consumption");

        var data = new XYChart.Series<String, Number>();

        data.getData().add(new XYChart.Data<>("2004", 82502));
        data.getData().add(new XYChart.Data<>("2005", 84026));
        data.getData().add(new XYChart.Data<>("2006", 85007));
        data.getData().add(new XYChart.Data<>("2007", 86216));
        data.getData().add(new XYChart.Data<>("2008", 85559));
        data.getData().add(new XYChart.Data<>("2009", 84491));
        data.getData().add(new XYChart.Data<>("2010", 87672));
        data.getData().add(new XYChart.Data<>("2011", 88575));
        data.getData().add(new XYChart.Data<>("2012", 89837));
        data.getData().add(new XYChart.Data<>("2013", 90701));

        areaChart.getData().add(data);
        areaChart.setLegendVisible(false);

        root.getChildren().add(areaChart);

        stage.setTitle("AreaChart");
        stage.setScene(scene);
        stage.show();
    }

    public static void main(String[] args) {
        launch(args);
    }
}
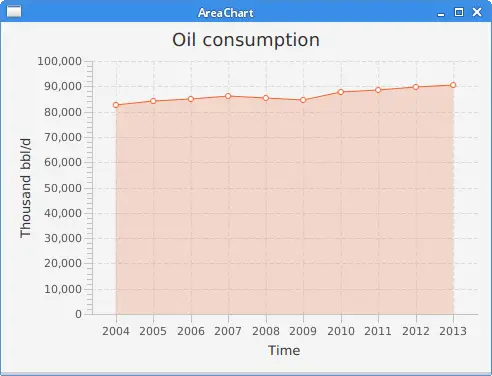
The example shows an area chart showing world crude oil consumption by year.
var areaChart = new AreaChart<>(xAxis, yAxis);
areaChart.setTitle("Oil consumption");
An area chart is created with the AreaChart.
var xAxis = new CategoryAxis();
xAxis.setLabel("Time");
CategoryAxis works on string categories. We display year strings
on this axis.
JavaFX ScatterChart
A scatter chart is a set of points plotted on a horizontal and vertical axes.
package com.zetcode;

import javafx.application.Application;
import javafx.scene.Scene;
import javafx.scene.chart.CategoryAxis;
import javafx.scene.chart.NumberAxis;
import javafx.scene.chart.ScatterChart;
import javafx.scene.chart.XYChart;
import javafx.scene.layout.HBox;
import javafx.stage.Stage;


public class ScatterChartEx extends Application {

    @Override
    public void start(Stage stage) {

        initUI(stage);
    }

    private void initUI(Stage stage) {

        var root = new HBox();

        var xAxis = new CategoryAxis();
        var yAxis = new NumberAxis("USD/kg", 30, 50, 2);

        var scatterChart = new ScatterChart<>(xAxis, yAxis);

        var data = new XYChart.Series<String, Number>();

        data.getData().add(new XYChart.Data<>("Mar 14", 43));
        data.getData().add(new XYChart.Data<>("Nov 14", 38.5));
        data.getData().add(new XYChart.Data<>("Jan 15", 41.8));
        data.getData().add(new XYChart.Data<>("Mar 15", 37));
        data.getData().add(new XYChart.Data<>("Dec 15", 33.7));
        data.getData().add(new XYChart.Data<>("Feb 16", 39.8));

        scatterChart.getData().add(data);
        scatterChart.setLegendVisible(false);

        var scene = new Scene(root, 450, 330);
        root.getChildren().add(scatterChart);

        stage.setTitle("Gold price");
        stage.setScene(scene);
        stage.show();
    }

    public static void main(String[] args) {
        launch(args);
    }
}
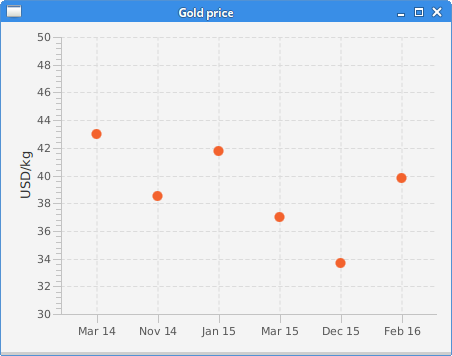
In the example, we use the ScatterChart to display gold
prices.
var xAxis = new CategoryAxis();
The x axis is a CategoryAxis used to display dates.
var yAxis = new NumberAxis("USD/kg", 30, 50, 2);
The y axis is a NumberAxis used to display gold prices. The
parameters of the constructor are: axis label, lower bound, upper bound, and
tick unit.
var data = new XYChart.Series<String, Number>();

data.getData().add(new XYChart.Data<>("Mar 14", 43));
...
A series of data is created with XYChart.Series and
its data items with XYChart.Data.
JavaFX BarChart
A bar chart presents grouped data with rectangular bars with lengths proportional to the values that they represent. The bars can be plotted vertically or horizontally.
package com.zetcode;

import javafx.application.Application;
import javafx.scene.Scene;
import javafx.scene.chart.BarChart;
import javafx.scene.chart.CategoryAxis;
import javafx.scene.chart.NumberAxis;
import javafx.scene.chart.XYChart;
import javafx.scene.layout.HBox;
import javafx.stage.Stage;


public class BarChartEx extends Application {

    @Override
    public void start(Stage stage) {

        initUI(stage);
    }

    private void initUI(Stage stage) {

        var root = new HBox();

        var scene = new Scene(root, 480, 330);
        var xAxis = new CategoryAxis();

        var yAxis = new NumberAxis();
        yAxis.setLabel("Gold medals");

        var barChart = new BarChart<>(xAxis, yAxis);
        barChart.setTitle("Olympic gold medals in London");

        var data = new XYChart.Series<String, Number>();

        data.getData().add(new XYChart.Data<>("USA", 46));
        data.getData().add(new XYChart.Data<>("China", 38));
        data.getData().add(new XYChart.Data<>("UK", 29));
        data.getData().add(new XYChart.Data<>("Russia", 22));
        data.getData().add(new XYChart.Data<>("South Korea", 13));
        data.getData().add(new XYChart.Data<>("Germany", 11));

        barChart.getData().add(data);
        barChart.setLegendVisible(false);

        root.getChildren().add(barChart);

        stage.setTitle("BarChart");
        stage.setScene(scene);
        stage.show();

    }

    public static void main(String[] args) {
        launch(args);
    }
}
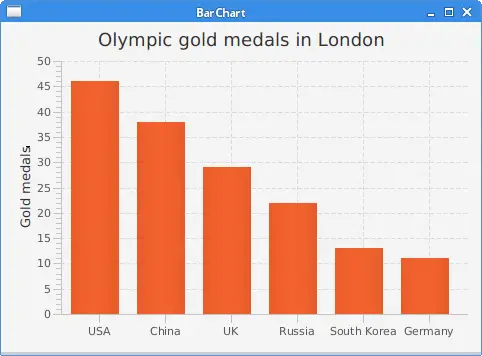
In the example, we use a bar chart to show the number of Olympic gold medals per country in London 2012.
var barChart = new BarChart(xAxis, yAxis);
A bar chart is created with BarChart.
JavaFX PieChart
A pie chart is a circular chart which is divided into slices to illustrate numerical proportion.
package com.zetcode;

import javafx.application.Application;
import javafx.collections.FXCollections;
import javafx.collections.ObservableList;
import javafx.scene.Scene;
import javafx.scene.chart.PieChart;
import javafx.scene.layout.HBox;
import javafx.stage.Stage;


public class PieChartEx extends Application {

    @Override
    public void start(Stage stage) {

        initUI(stage);
    }

    private void initUI(Stage stage) {

        var root = new HBox();

        var scene = new Scene(root, 450, 330);

        ObservableList<PieChart.Data> pieChartData
                = FXCollections.observableArrayList(
                new PieChart.Data("Apache", 52),
                new PieChart.Data("Nginx", 31),
                new PieChart.Data("IIS", 12),
                new PieChart.Data("LiteSpeed", 2),
                new PieChart.Data("Google server", 1),
                new PieChart.Data("Others", 2));

        var pieChart = new PieChart(pieChartData);
        pieChart.setTitle("Web servers market share (2016)");

        root.getChildren().add(pieChart);

        stage.setTitle("PieChart");
        stage.setScene(scene);
        stage.show();
    }

    public static void main(String[] args) {
        launch(args);
    }
}
The example uses a pie chart to show the market share of web servers.
ObservableList<PieChart.Data> pieChartData
        = FXCollections.observableArrayList(
                new PieChart.Data("Apache", 52),
                new PieChart.Data("Nginx", 31),
                new PieChart.Data("IIS", 12),
                new PieChart.Data("LiteSpeed", 2),
                new PieChart.Data("Google server", 1),
                new PieChart.Data("Others", 2));
Pie chart data items are created with the PieChart.Data.
var pieChart = new PieChart(pieChartData);
A pie chart is created with the PieChart class.

In this chapter, we have created a LineChart, an
AreaChart, a ScatterChart,
a BarChart, and a PieChart in JavaFX.
JFreechart tutorial
shows how to create charts in a popular JFreechart library.