HTML5 canvas shapes
last modified July 17, 2023
In this part of the HTML5 canvas tutorial, we create some basic and more advanced geometric shapes.
Rectangles
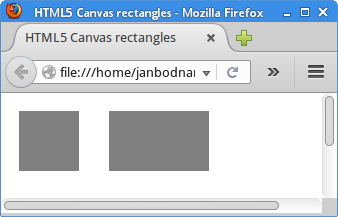
The first program draws two rectangles.
<!DOCTYPE html>
<html>
<head>
<title>HTML5 canvas rectangles</title>
<script>
    function draw() {

        var canvas = document.getElementById('myCanvas');
        var ctx = canvas.getContext('2d');

        ctx.fillStyle = 'gray';
        ctx.fillRect(10, 10, 60, 60);
        ctx.fillRect(100, 10, 100, 60);
    }
</script>
</head>

<body onload="draw();">
    <canvas id="myCanvas" width="350" height="250">
    </canvas>
</body>
</html>
The example uses the drawRect method to paint
rectangles.
ctx.fillStyle = 'gray';
The interiors of the rectangles are painted in gray colour.
ctx.fillRect(10, 10, 60, 60);
ctx.fillRect(100, 10, 100, 60);
The fillRect method is used to draw both a
square and a rectangle. The first two parameters are
x and y coordinates of a shape to be drawn. The last two parameters are
the width and the height of the shape.
Basic shapes
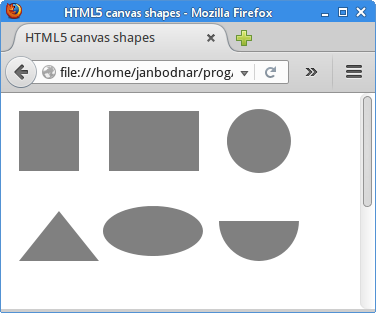
In the following program, we draw some basic shapes.
<!DOCTYPE html>
<html>
<head>
<title>HTML5 canvas shapes</title>
<script>
    function draw() {

        var canvas = document.getElementById('myCanvas');
        var ctx = canvas.getContext('2d');

        ctx.fillStyle = 'gray';
        ctx.fillRect(10, 10, 60, 60);
        ctx.fillRect(100, 10, 90, 60);

        ctx.beginPath();
        ctx.arc(250, 40, 32, 0, 2*Math.PI);
        ctx.fill();

        ctx.beginPath();
        ctx.moveTo(10, 160);
        ctx.lineTo(90, 160);
        ctx.lineTo(50, 110);
        ctx.closePath();
        ctx.fill();

        ctx.save();
        ctx.scale(2, 1);
        ctx.beginPath();
        ctx.arc(72, 130, 25, 0, 2*Math.PI);
        ctx.fill();
        ctx.restore();

        ctx.beginPath();
        ctx.arc(250, 120, 40, 0, Math.PI);
        ctx.fill();
    }
</script>
</head>

<body onload="draw();">
<canvas id="myCanvas" width="350" height="350">
</canvas>
</body>

</html>
Six different shapes are drawn on the canvas.
ctx.fillStyle = 'gray';
The shapes will be painted in gray colour.
ctx.fillRect(10, 10, 60, 60);
ctx.fillRect(100, 10, 90, 60);
The rectangles are drawn with the fillRect method.
A rectangle is the only shape not initiated by the beginPath
method.
ctx.beginPath();
ctx.arc(250, 40, 32, 0, 2*Math.PI);
ctx.fill();
A circle is drawn with the arc method. The method adds
an arc to the created path. The first two parameters define the x and y
coordinates of the point around which the arc is centered. The next
two parameters specify the start and the end angle of the arc.
The angles are defined in radians. The last parameter is optional; it
specifies the direction in which the arc is drawn. The default direction
is clockwise.
ctx.beginPath();
ctx.moveTo(10, 160);
ctx.lineTo(90, 160);
ctx.lineTo(50, 110);
ctx.closePath();
ctx.fill();
With the moveTo and lineTo methods, we draw
a triangle. The closePath method causes the pen to move back
to the start of the current sub-path. In our case, it finishes the triangle
shape.
ctx.save();
ctx.scale(2, 1);
ctx.beginPath();
ctx.arc(72, 130, 25, 0, 2*Math.PI);
ctx.fill();
ctx.restore();
An oval shape is drawn by scaling a circle. The operations are placed
between the save and restore methods
so that the scale operation does not affect the subsequent drawings.
ctx.beginPath();
ctx.arc(250, 120, 40, 0, Math.PI);
ctx.fill();
The last shape, a semicircle, is drawn with the arc method.
Pie chart
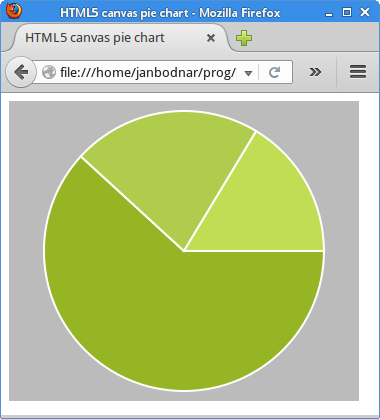
A pie chart is a circular chart, which is divided into slices to illustrate numerical proportion.
<!DOCTYPE html>
<html>
<head>
<title>HTML5 canvas pie chart</title>
<style>
    canvas {background: #bbb}
</style>
<script>
    function draw() {

        var canvas = document.getElementById('myCanvas');
        var ctx = canvas.getContext('2d');

        var beginAngle = 0;
        var endAngle = 0;
        var data = [170, 60, 45];
        var total = 0;
        var colours = ["#95B524", "#AFCC4C", "#C1DD54"];
        const SPACE = 10;

        for (var i = 0; i < data.length; i++) {
          total += data[i];
        }

        ctx.strokeStyle = 'white';
        ctx.lineWidth = 2;

        for (var j = 0; j < data.length; j++) {

            endAngle = beginAngle + (Math.PI * 2 * (data[j] / total));
            ctx.fillStyle = colours[j];
            ctx.beginPath();
            ctx.moveTo(canvas.width/2, canvas.height/2);
            ctx.arc(canvas.width/2, canvas.height/2, canvas.height/2 - SPACE,
                beginAngle, endAngle, false);
            ctx.closePath();
            ctx.fill();
            ctx.stroke();
            beginAngle = endAngle;
        }
    }
</script>
</head>
<body onload="draw();">
    <canvas id="myCanvas" width="350" height="300">
    </canvas>
</body>
</html>
The example draws a pie chart. It has three slices, painted in different shades of a green colour.
<style>
    canvas {background: #bbb}
</style>
In order for the white outlines of the chart to be clearly visible, we change the background colour of the canvas to gray colour.
var data = [170, 60, 45];
This is the data that the pie chart illustrates.
const SPACE = 10;
The SPACE constant is a distance from the pie chart
to the borders of the canvas.
endAngle = beginAngle + (Math.PI * 2 * (data[j] / total));
The formula calculates the end angle of the currently painted slice.
ctx.moveTo(canvas.width/2, canvas.height/2);
ctx.arc(canvas.width/2, canvas.height/2, canvas.height/2 - SPACE,
    beginAngle, endAngle, false);
ctx.closePath();
Three methods are used to paint the current slice: moveTo,
arc, and closePath.
ctx.fill();
ctx.stroke();
We draw both the insides and outlines of the shapes.
beginAngle = endAngle;
For the next slice, the last ending angle becomes the beginning angle.
Star
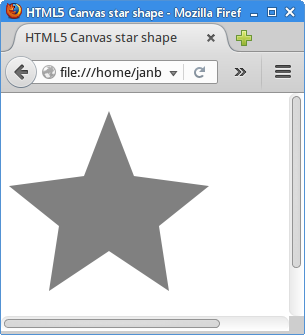
The following example creates a star shape.
<!DOCTYPE html>
<html>
<head>
<title>HTML5 canvas star shape</title>
<script>
    function draw() {

        var canvas = document.getElementById('myCanvas');
        var ctx = canvas.getContext('2d');

        ctx.fillStyle = 'gray';

        var points = [ [ 0, 85 ], [ 75, 75 ], [ 100, 10 ], [ 125, 75 ],
            [ 200, 85 ], [ 150, 125 ], [ 160, 190 ], [ 100, 150 ],
            [ 40, 190 ], [ 50, 125 ], [ 0, 85 ] ];

        var len = points.length;

        ctx.beginPath();
        ctx.moveTo(points[0][0], points[0][1]);

        for (var i = 0; i < len; i++) {
            ctx.lineTo(points[i][0], points[i][1]);
        }

        ctx.fill();

    }
</script>
</head>

<body onload="draw();">
    <canvas id="myCanvas" width="350" height="250">
    </canvas>
</body>
</html>
A star shape is created from a series of points.
var points = [ [ 0, 85 ], [ 75, 75 ], [ 100, 10 ], [ 125, 75 ],
    [ 200, 85 ], [ 150, 125 ], [ 160, 190 ], [ 100, 150 ],
    [ 40, 190 ], [ 50, 125 ], [ 0, 85 ] ];
These are the coordinates of the star.
ctx.moveTo(points[0][0], points[0][1]);
We move to the initial coordinate of the shape with the
moveTo method.
for (var i = 0; i < len; i++) {
    ctx.lineTo(points[i][0], points[i][1]);
}
Here we connect all the coordinates of the star using the lineTo method.
ctx.fill();
The fill method fills the interior of the star shape with
the defined (gray) colour.
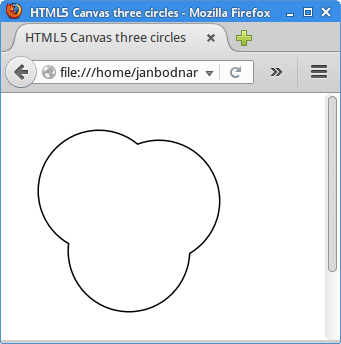
Three circles
It is possible to create new shapes with compositing. Compositing is a rule that determines the way the shapes in a canvas blend.
<!DOCTYPE html>
<html>
<head>
<title>HTML5 Canvas three circles</title>
<script>
    function draw() {

        var canvas = document.getElementById('myCanvas');
        var ctx = canvas.getContext('2d');

        ctx.lineWidth = 3;

        ctx.fillStyle = 'gray';
        ctx.beginPath();
        ctx.arc(90, 90, 60, 0, 2*Math.PI);
        ctx.stroke();

        ctx.beginPath();
        ctx.arc(120, 150, 60, 0, 2*Math.PI);
        ctx.stroke();

        ctx.beginPath();
        ctx.arc(150, 100, 60, 0, 2*Math.PI);
        ctx.stroke();

        ctx.globalCompositeOperation='destination-out';

        ctx.beginPath();
        ctx.arc(90, 90, 60, 0, 2*Math.PI);
        ctx.fill();

        ctx.beginPath();
        ctx.arc(120, 150, 60, 0, 2*Math.PI);
        ctx.fill();

        ctx.beginPath();
        ctx.arc(150, 100, 60, 0, 2*Math.PI);
        ctx.fill();
    }
</script>
</head>

<body onload="draw();">
    <canvas id="myCanvas" width="400" height="350">
    </canvas>
</body>
</html>
The example creates a shape by combining the outlines of three circles. The three circles overlap.
ctx.beginPath();
ctx.arc(90, 90, 60, 0, 2*Math.PI);
ctx.stroke();
A circle is drawn on the canvas.
ctx.globalCompositeOperation='destination-out';
The compositing operation is set to destination-out.
In this mode, the destination is displayed everywhere the source and
destination do not overlap. Everywhere else, transparency is displayed.
ctx.beginPath();
ctx.arc(90, 90, 60, 0, 2*Math.PI);
ctx.fill();
Now the same circles are filled with gray colour. New drawings will erase existing drawings where the two overlap. As a consequence, only the outlines remain.
In this part of the HTML5 canvas tutorial, we have covered some basic and more advanced shapes in HTML5 canvas.